by Skip Via
skip@westvalleynaturalists.org
Editor’s Note: Three days after this post was written, Montana FWP announced an “unprecedented” fishery closure (“hoot owl restrictions”) on the North Fork of the Flathead River due to record high water temperatures and rapidly decreasing stream flow in the absence of any meaningful precipitation this summer.
A year ago, when most of the valley was in the throes of an extreme drought, I posted an article titled Hydrology Snapshot, July 2023 in which I started the process of keeping track of some issues related to water usage, precipitation, and water management in the Flathead Valley.
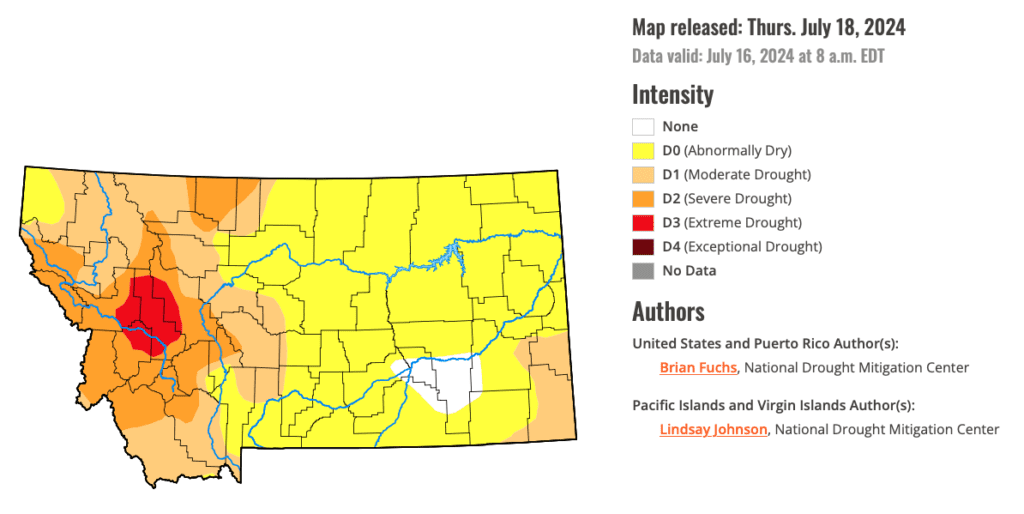
It’s now mid-July 2024. We’re still experiencing drought conditions, but the severity has been downgraded to moderate/severe. Droughts are rated on a 5 point scale: D0 (Abnormally dry), D1 (Moderate), D2 (Severe), D3 (Extreme), and D4 (Exceptional). 99.62% of the Flathead is considered to be in Moderate (D1) conditions as of this writing.
While our snowpack in 2024 was similar to 2023 (approximately 78% of normal), we have experienced near normal levels of valley precipitation this spring–at least up until early July when an extreme heat dome developed over much of the west, halting precipitation here and bringing temperatures well into the 90s F in the valley for several weeks. (It’s 95˚F as I write this.)
This precipitation pattern was consistent with the El Niño weather pattern that developed in fall/winter of 2023–less precipitation (remember the non-white Christmas?) and warmer temperatures overall. (Reference this article from the Flathead Beacon.) As with any weather pattern, variations from predictions are common. We’ll all probably remember the thankfully short-lived -35˚F temperatures of last January–especially if you are a cherry grower. But our average temperature for the season was above normal.
What does this mean for water in our valley?
In an article from April 2023 titled Water Water Everywhere?, I went into some detail about the way our local aquifers (confined and unconfined) are replenished. Essentially, mountain snowpack replenishes the Deep Aquifer–the source of all municipal water and virtually all of the domestic and agricultural water in the Flathead. Valley precipitation replenishes the unconfined aquifers that sit above the Deep Aquifer. The local water table, typically evident in the water levels of ponds and lakes in the valley, is a function of the amount of water in the shallow unconfined aquifers that crisscross our valley. When pond levels are low, it’s generally an indication that the water table is dropping. (The article explains this in better detail.)
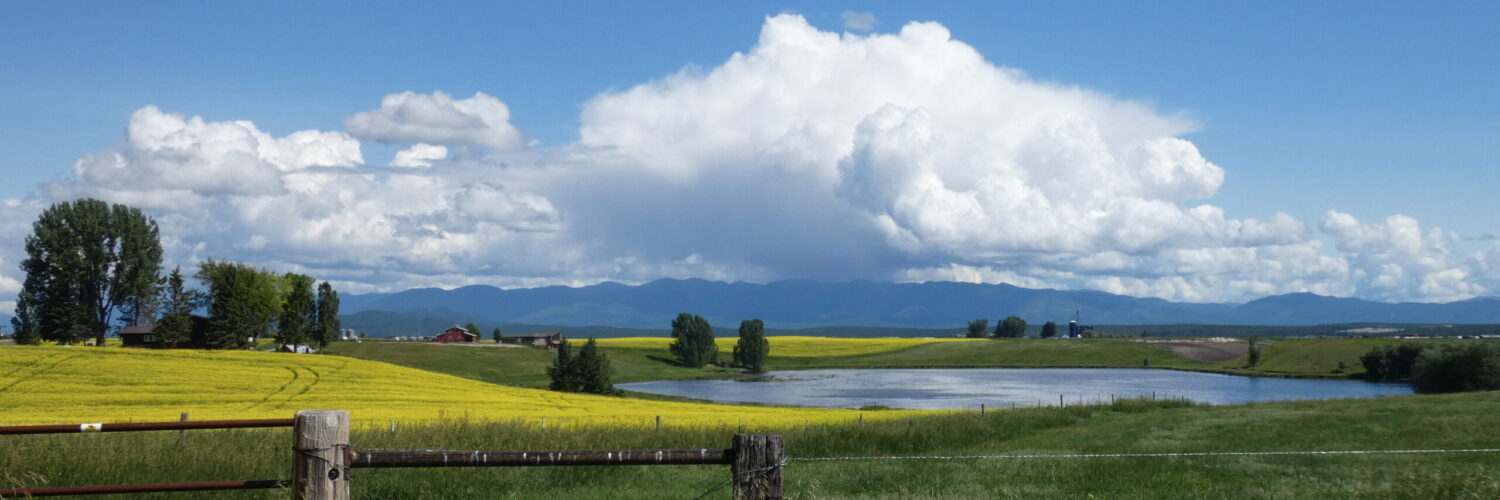
Take a look at this image (the same one that we use at the top of each page of our web site) taken six years ago. Notice the water level of the pond (in the Potholes area of West Valley).
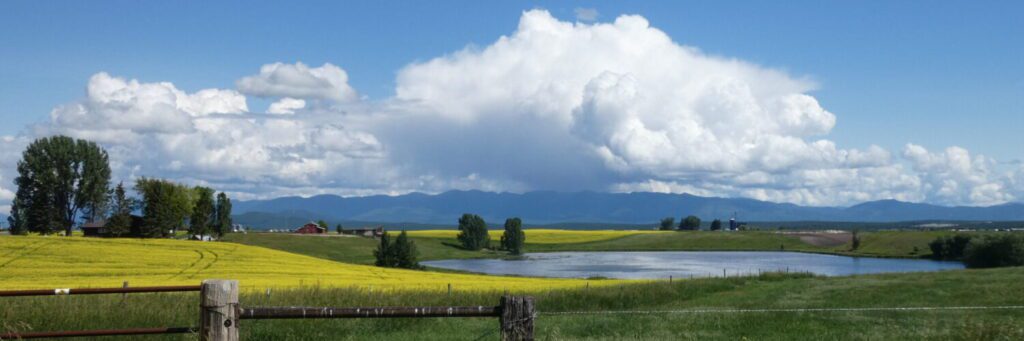
Below is an image from the same location taken in July 2023:
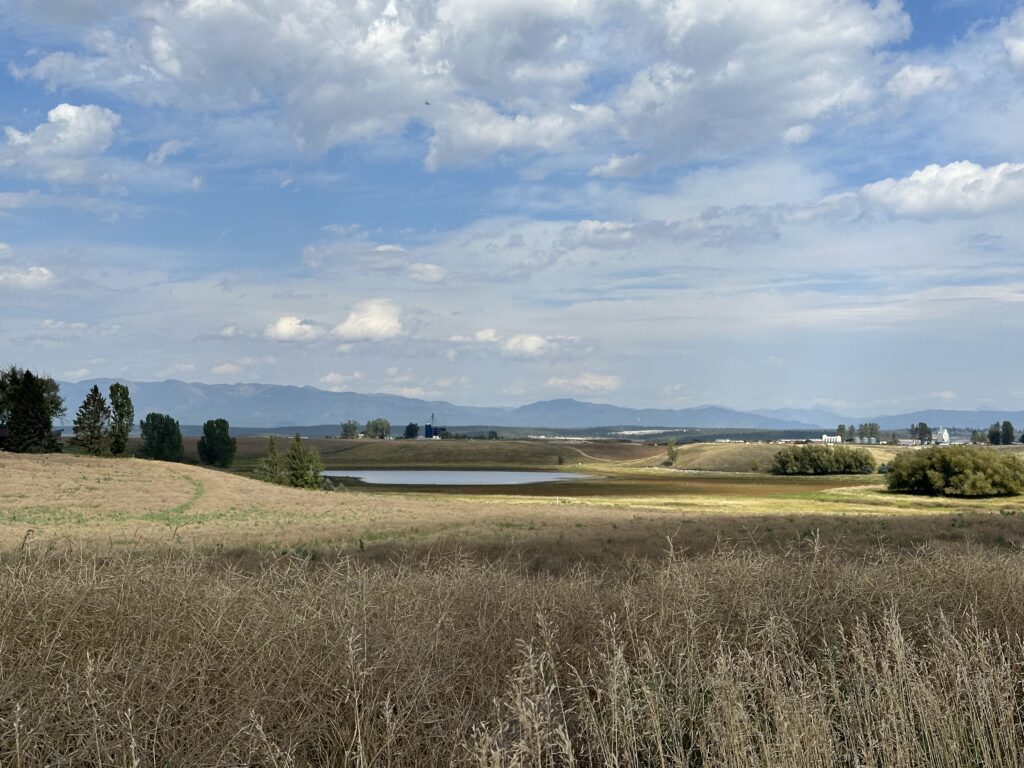
And finally, an image taken a few days ago (mid-July 2024):
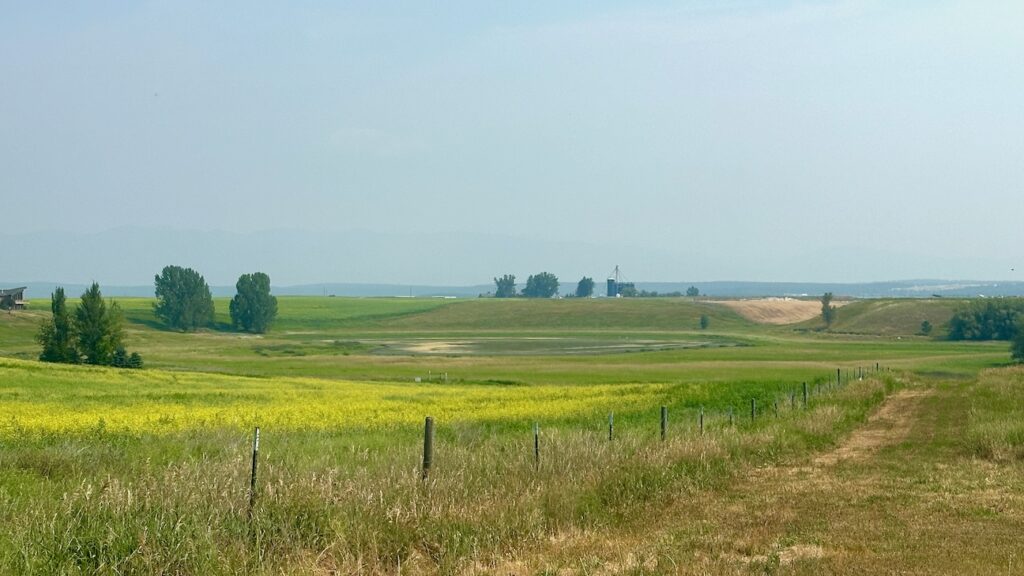
The trend is pretty obvious. Even with good spring rainfall, there is virtually no standing water in this pond.
It’s important to note that a few years do not a trend make. Weather conditions can change quickly. It may well be that in five years, this pond will be completely filled again. But climate change models predict exactly this kind of thing over time. Heat domes become more frequent and more intense, precipitation events tend to be more extreme on both the dry and wet ends of things, and overall temperature patterns rise.
It will be interesting to see what this winter brings. Stay tuned.